Metrics, logs and traces are usually presented as three products to buy. They are more usefully three shapes of data, and the shape decides where a given piece of information belongs.
- Metrics are numbers aggregated over time, indexed by a small set of label combinations. They are cheap and compress well, and their cost is a product of label cardinality. They answer "how much, how many, how fast" for the whole system, and nothing about one particular request.
- Logs are discrete events with arbitrary fields, indexed per event. They are expensive per unit of information, but they can carry anything, including high-cardinality identifiers.
- Traces are causally linked spans across services, indexed by a trace id. They are the only signal that shows a request's path through a distributed system, and the only one that can attribute latency to a hop.
Cardinality, multiplied out
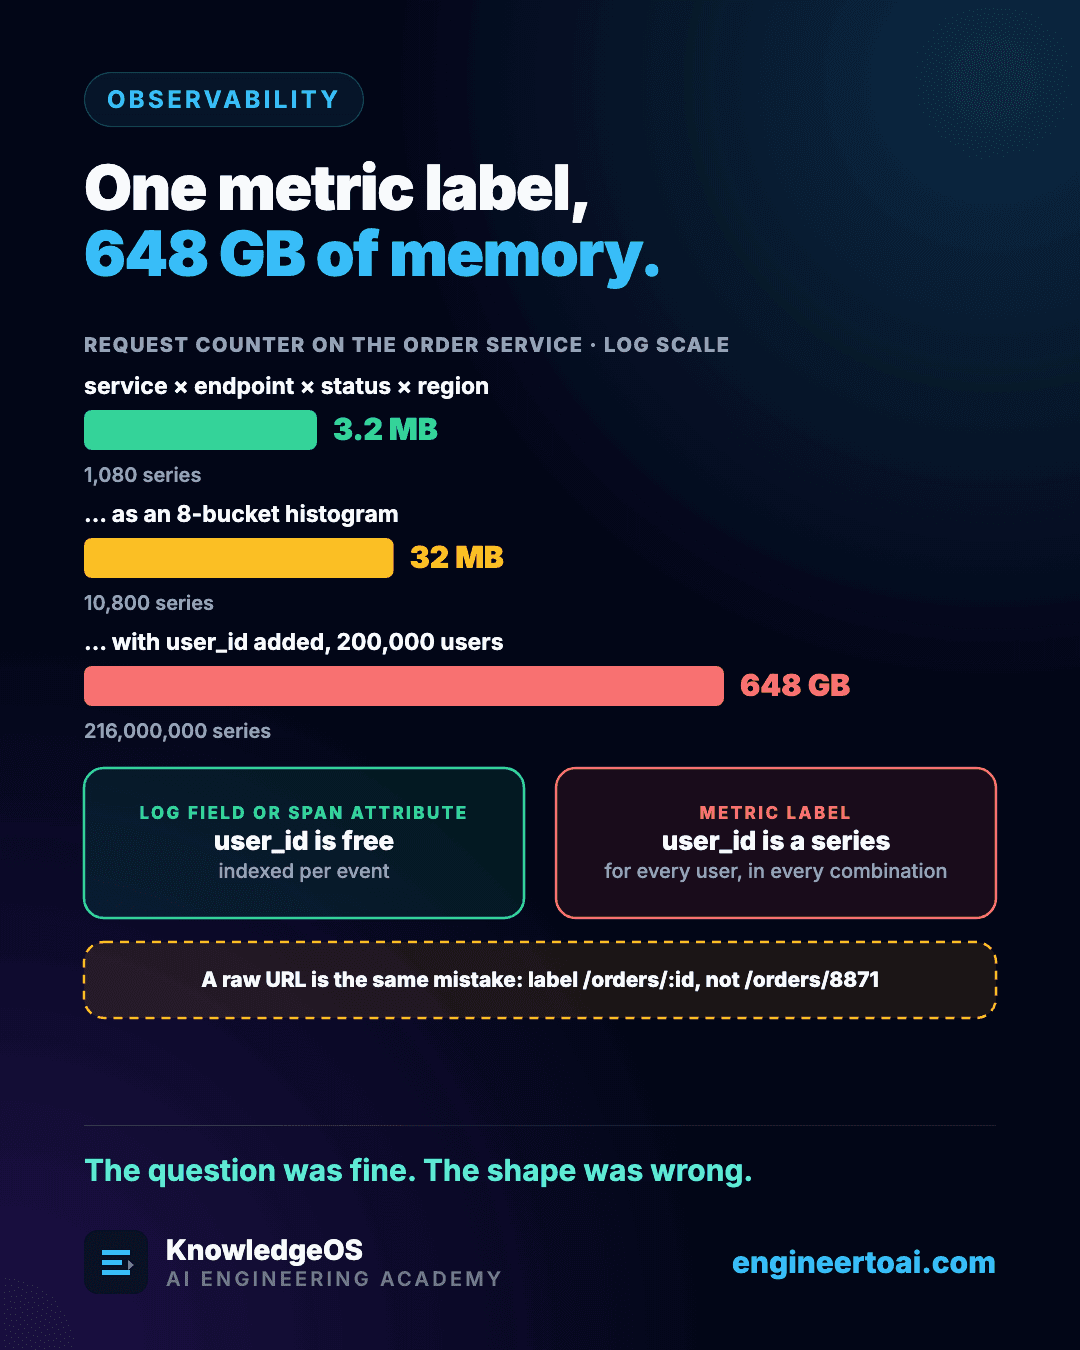
Take a request counter on the order service with four sensible labels: 6 services, 12 endpoints, 5 status codes and 3 regions. At about 3 KB of Prometheus memory per active series:
| Labels | Series | Memory |
|---|---|---|
| service × endpoint × status × region | 1,080 | 3.2 MB |
| The same counter as a histogram with 8 buckets, plus sum and count | 10,800 | 32 MB |
| The counter with user_id added, for 200,000 users | 216,000,000 | 648 GB |
The last row is not an exaggeration. It is one label, added by someone who wanted to know which customers were affected, which is an entirely reasonable thing to want. The same field in a log line or a span attribute costs nothing structural, because those are indexed per event rather than per label combination. The question was fine; the shape was wrong.
The middle row catches people who already know that rule. A histogram multiplies the series count by its number of buckets plus two, so the eight-bucket latency histogram an SLO needs carries ten times the cardinality of the counter beside it. That is still cheap at 10,800, but the multipliers compound: put user_id on the histogram instead of the counter and the last row becomes 2.16 billion series.
Which shape answers which question
| You want to know | Shape |
|---|---|
| How many orders failed in the last hour | Metric |
| Which customer's orders failed | Log field or span attribute |
| Why this one order took 2 seconds | Trace |
Common Mistake
Keeping user_id out of the labels but adding the full URL, query string and all. A raw path with ids and parameters in it is just as unbounded: /orders/8871?ref=email becomes its own series for good. Normalise to the route template, /orders/:id, in the instrumentation layer rather than trusting every caller to be tidy. The tell is a series count that keeps growing with traffic instead of levelling off.