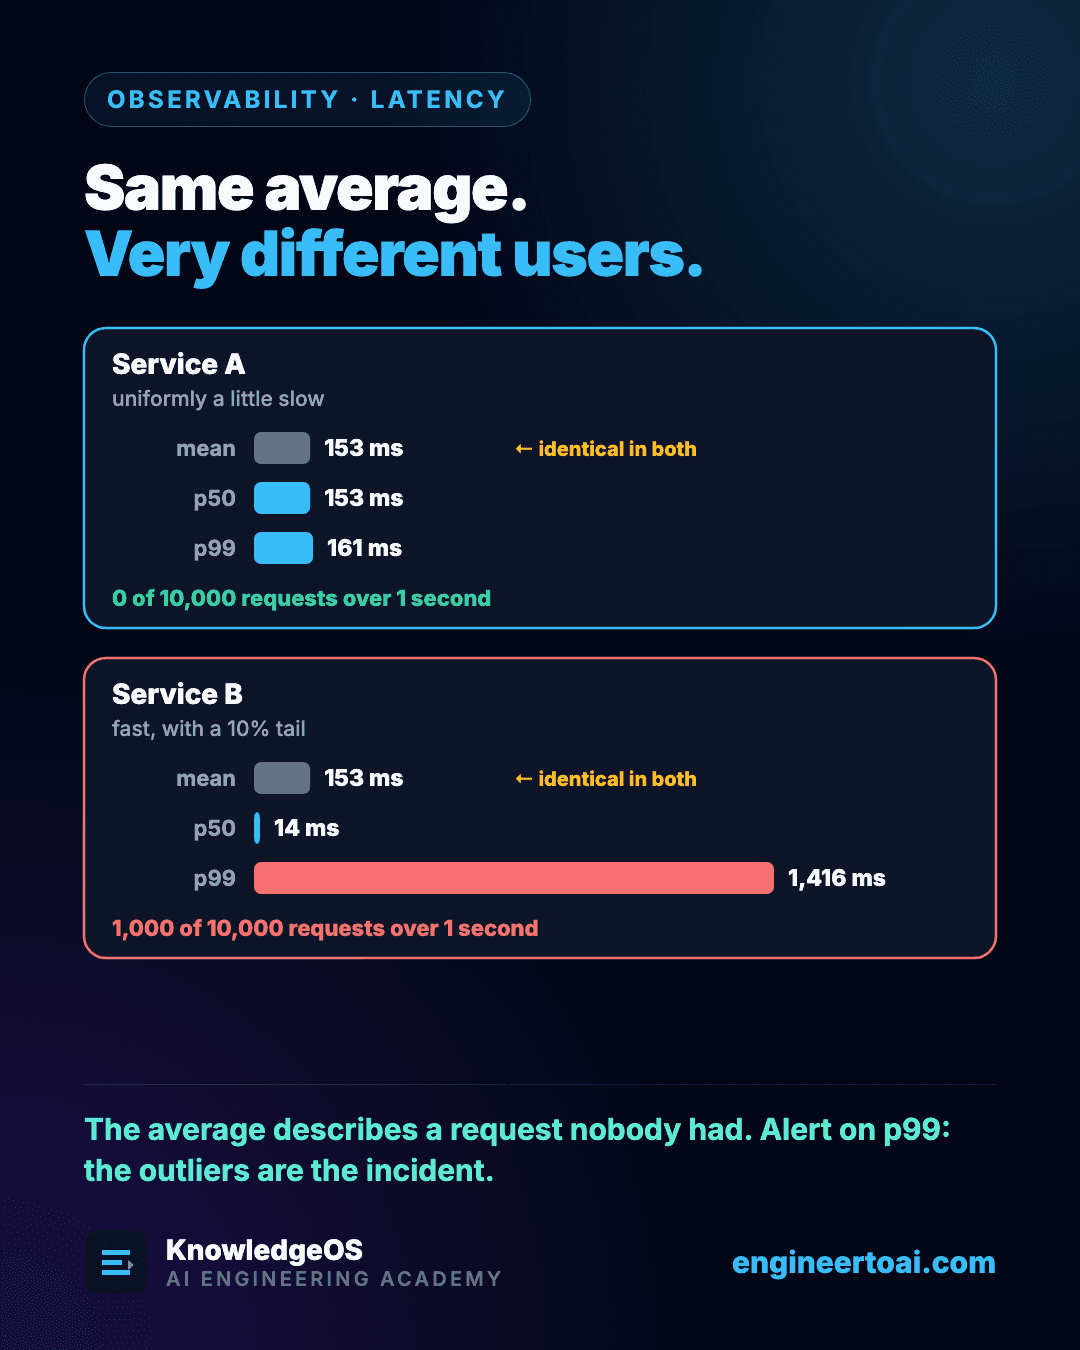
Two services each handle 10,000 requests. A latency dashboard that shows the mean reports the same number for both: 153.0 ms, identical to one decimal place. They are not the same service.
| Mean | p50 | p90 | p99 | Max | Requests over 1 s | |
|---|---|---|---|---|---|---|
| Service A, uniformly a little slow | 153.0 ms | 153.0 ms | 160.0 ms | 161.0 ms | 161.0 ms | 0 |
| Service B, fast with a 10% tail | 153.0 ms | 14.0 ms | 17.0 ms | 1,416.0 ms | 1,419.0 ms | 1,000 |
In service A, nobody waits more than 161 ms. In service B, a thousand people wait almost a second and a half.
The mean is doing exactly its job
A mean measures central tendency. It is deliberately insensitive to outliers, and in latency the outliers are the incident. Asking the mean to show a slow tail is asking it to do the one thing it was designed not to do.
Two things make it worse in practice. First, the mean has no unit of experience: no user of service B ever waited 153 ms. Their requests took about 14 ms or about 1,400 ms, and the average describes a request that never happened.
Second, the tail is not a small group of people. A p99 affects one request in a hundred, but a page or session that makes 100 requests is likely to hit it at least once: if each request independently has a 1% chance of landing in the tail, the chance is 1 − 0.99¹⁰⁰, about 63%. Fan-out turns a rare request into a common experience.
What to watch instead
- Percentiles per endpoint: p50 for the typical request, p99 and the maximum for the people having a bad time.
- A count of requests over a threshold you care about, such as one second. It reads like the table above, and it maps directly to an objective.
- Histograms, aggregated across servers. They can be merged; percentiles cannot.
Common Mistake
Averaging each server's p99 to get a fleet-wide p99. Percentiles do not combine that way: the mean of eight servers' p99 values is not the p99 of all their requests. Merge the latency histograms first, then read the percentile from the result.
The mean still has a use: it tracks total work and capacity. It just cannot tell you who is waiting.